When starting out using Hadoop with Amazon’s EMR I would normally go through a process of trial and error, deciding what size and type of machines to have in my cluster to run the job as efficiently as possible. That was until I discovered a monitoring tool to help me decide, Ganglia
Ganglia is a website that gets installed on the cluster at the bootstrap stage that provides insight into how each box in the cluster is performing. If you noticed that the CPU was running high it might be wise to choose EC2 instances that had larger cores, or if the memory was over utilised then maybe choose EC2 instances with a larger memory capacity.
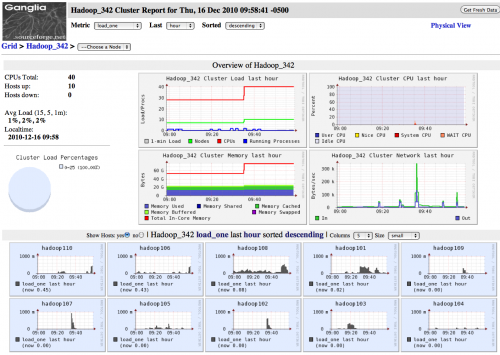
Ganglia offers many features such as showing each machine in the cluster on its own graph with a different colour background which is dictated by the stress on the machine, from blue meaning minimal load to red indicating that the machine is under a great amount of stress. This is a quick and useful way of telling you to use larger or smaller boxes.
As Hadoop utilises the JVM it provides a vast array of statistics that the JVM can output, so you can check specific areas of the job throughout the process. Not only can you check the cluster overall, you can also filter down the results to an individual machine, which can be a good to way to find a bad or redundant machine in your cluster.
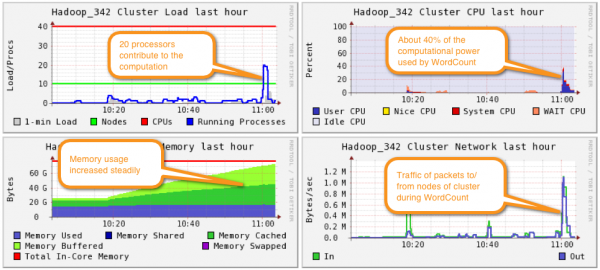
When using Ganglia with Hadoop’s built-in Job Tracker you can see how the cluster performs at each stage of the Hadoop job; the Mapper stage and the Reducer stage, which sometimes leaves you with a dilemma as you may see the cluster under great stress during one of the stages but not in the other which normally means deciding to use larger machines to ease the most demanding stage as opposed to altering the cluster size in flight.
To install Ganglia on your Hadoop cluster using EMR just add the following bootstrap (no arguments required):
Action-Name : ganglia-monitoring

Path : s3://elasticmapreduce/bootstrap-actions/install-ganglia
To access the Ganglia website running on your Hadoop cluster you need to open up the Security Group ports. For simplicity if you open up port 80 on the ElasticMapReduce security groups; master and slave, then using the Master Public DNS Name entry, which is found on the description tab of the running EMR console view. You can then access the website using the url:
http://<Master Public DNS Name>/ganglia

e.g. http://ec2-54-220-183-114.eu-west-1.compute.amazonaws.com/ganglia/
Ganglia isn’t the ‘be all and end all’ for Hadoop monitoring but it is extremely useful and has a vast array of reports that do compliment the Hadoop process very nicely.
Author : Billy Oliver
References:
Ganglia Monitoring System – http://ganglia.sourceforge.net/